

 |
Welcome to the | |
 |
AACES-2 Project | |
| Australian Airborne Cal/val Experiment for SMOS |
|
Home page
Google Earth (KML file) Workplan SMOS AMSR-E WindSat ASCAT PALSAR ASAR MODIS MTSAT-1R ASTER Landsat CHRIS AVNIR-2 PLMR data Thermal Infrared data Multi-Spectral data Monitoring stations Soil moisture sampling Vegetation sampling Campaign shapefiles DEM Land use Climate data Soil classification Soil water capacity Soil texture analysis AACES homepage Moisturemap homepage |
Multi-Spectral data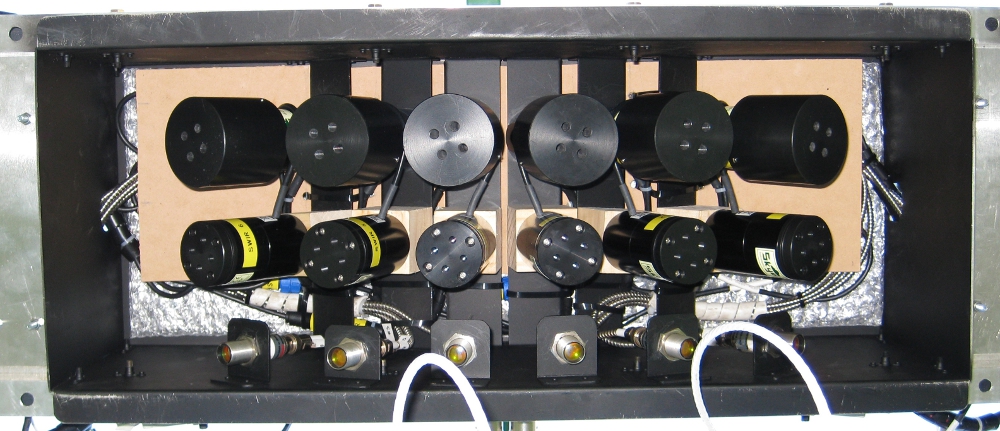 Sensor box with 12 multi-spectral sensors (two upper rows) and 6 thermal infrared sensors (bottom row)
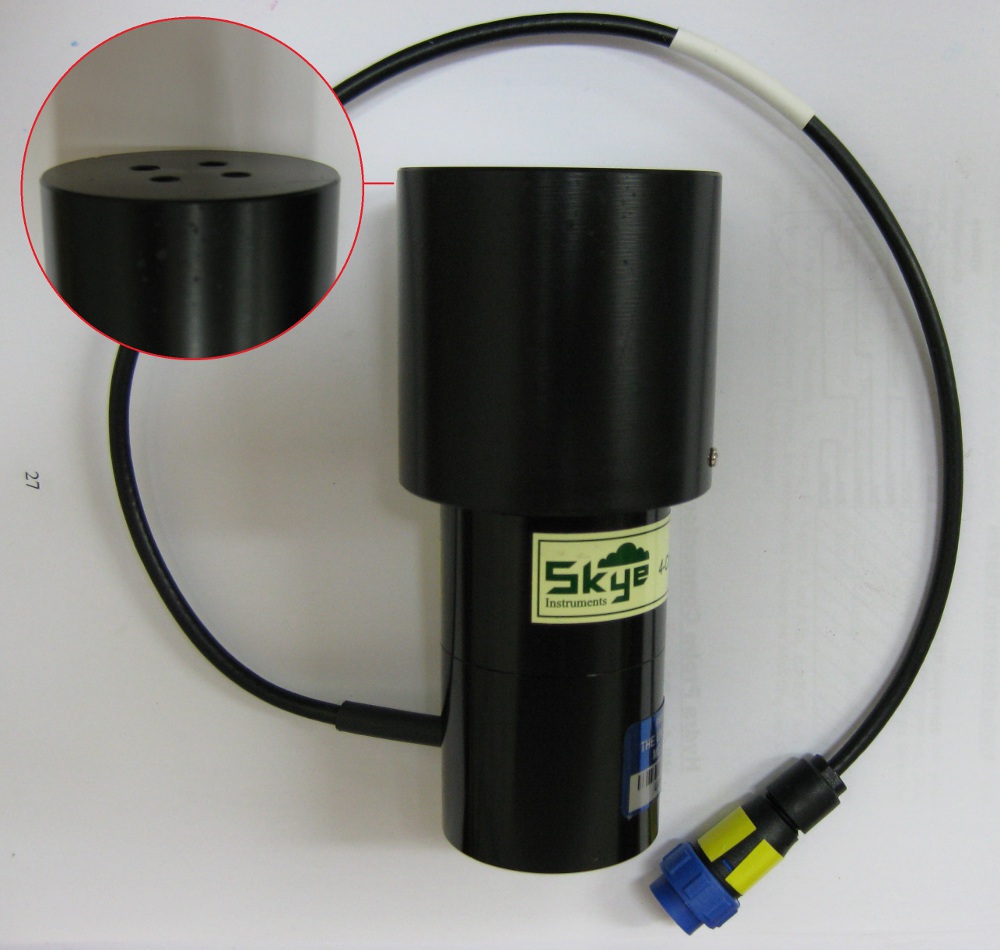 VNIR sensor (downward)
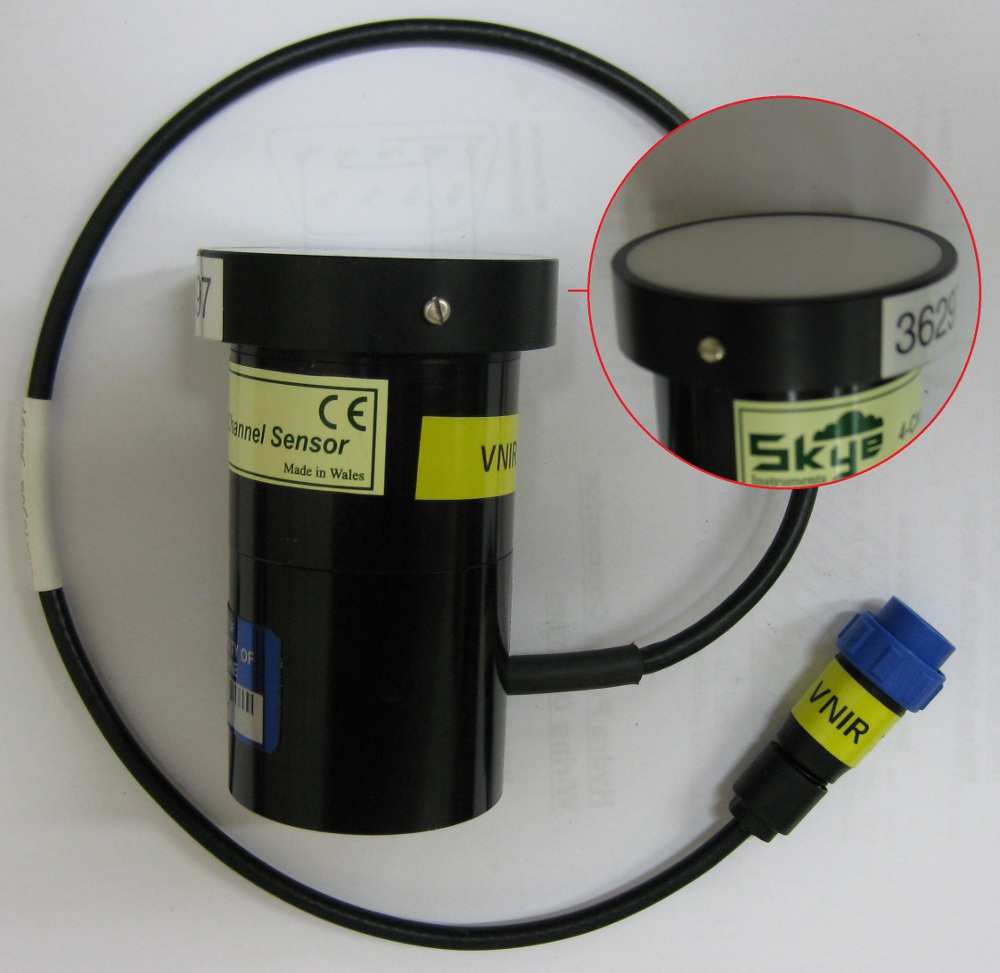 VNIR sensor (upward)
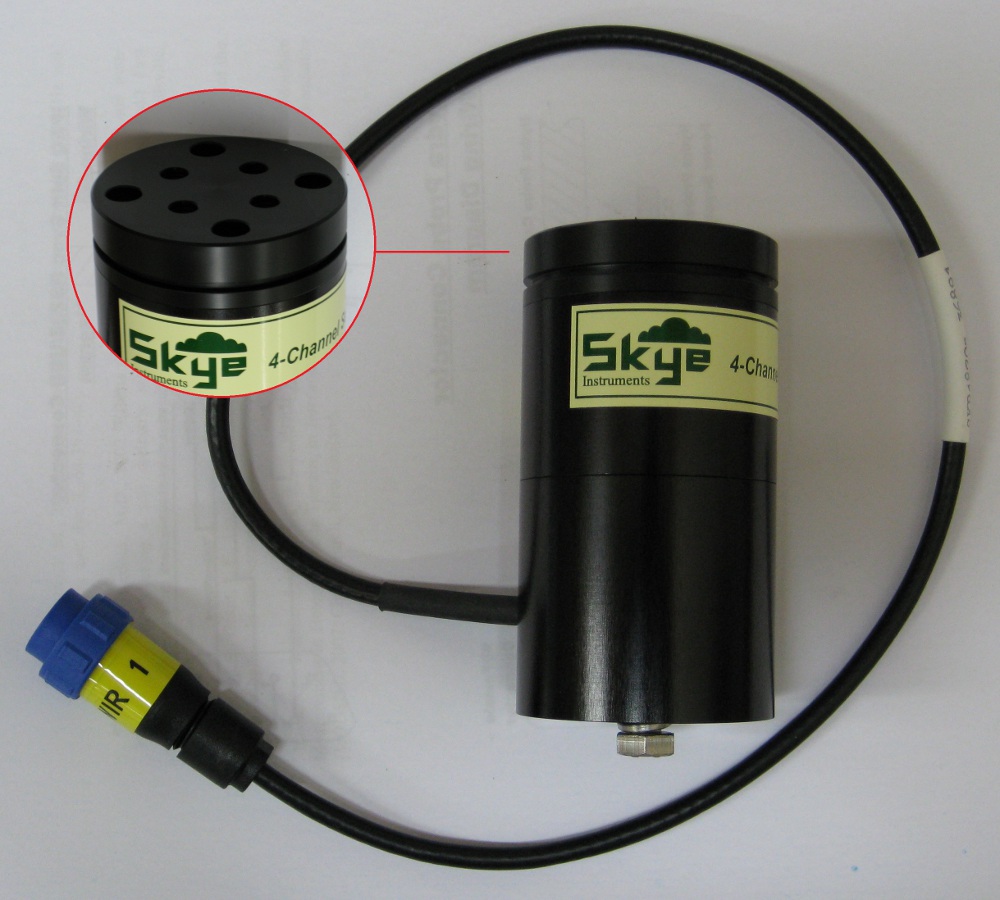 SWIR sensor (downward)
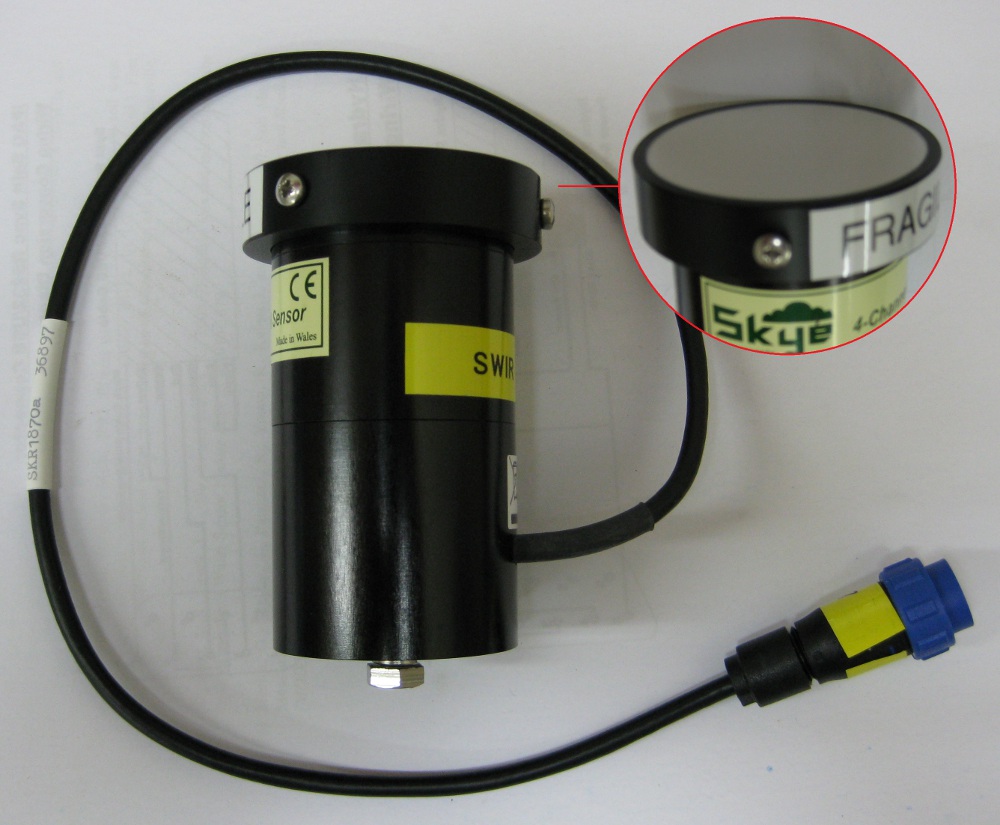 SWIR sensor (upward)
The multi-spectral measurements are made using an array of 15° FOV Skye 4-channel sensors, each with 0-5 V signal output. When installed, these sensors are configured in a similar way to the Everest thermal infrared radiometers (bottom row in first picture), such that the six downward-looking sensors have the same incidence angle and footprints as the six PLMR beams. However, to correct for incident radiation, an upward-looking sensor with cosine diffuser is also installed. Each sensor weighs approximately 400g and has a size of 8.2cm × 4.4cm without the cosine diffuser or field of view collar attached). Two arrays of 4 channel sensors are installed, with the following (matched) spectral bands:
All collected multi-spectral data can be requested from Dr. Chris Rüdiger: Chris.Rudiger@monash.edu |
||||||||||||||||||||||||||||||
|
Created: September 2010 Last Modified: September 2010 Maintainer: YE Nan, Ye.Nan@monash.edu |