| |
Welcome to the | |
| |
AACES-1 Project | |
| Australian Airborne Cal/val Experiment for SMOS |
|
Home page
Google Earth (KML file) Workplan SMOS AMSR-E WindSat ASCAT PALSAR ASAR MODIS MTSAT-1R ASTER Landsat CHRIS AVNIR-2 PLMR data Thermal Infrared data Multi-Spectral data Monitoring stations Soil moisture sampling Vegetation sampling Roughness sampling Campaign shapefiles DEM Land use Climate data Rainfall data Soil classification Soil water capacity Soil texture analysis AACES homepage Moisturemap homepage |
Soil Moisture Sampling For logistical reasons, the AACES transect has been divided into 10 patches, with each patch being the focus of a single day of ground monitoring and coincident aircraft/SMOS coverage. Thus, a total of 20 focus farms have been selected over the entire catchment to provide ground truth for several 1km resolution PLMR pixels along the flight track. 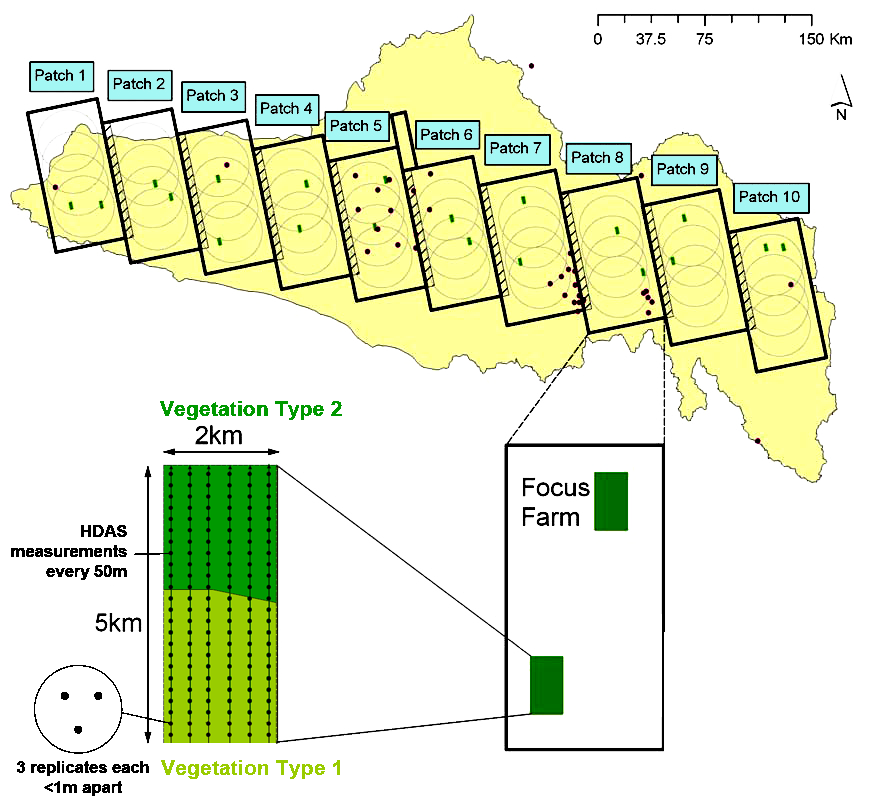 Schematic of HDAS soil moisture sampling strategy
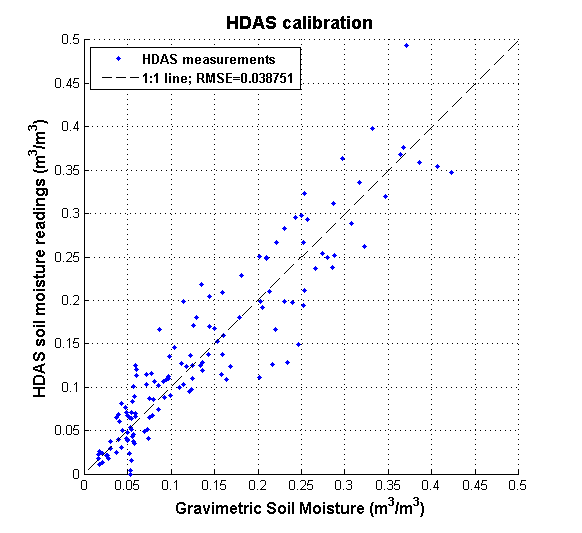
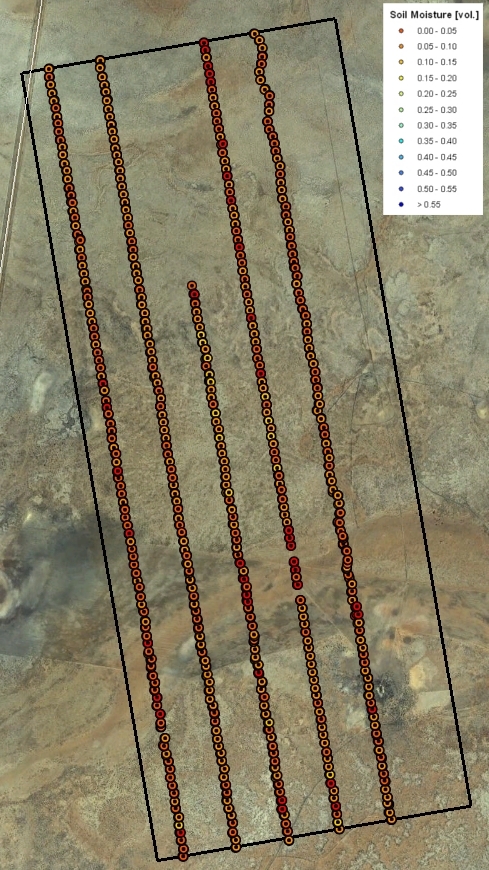
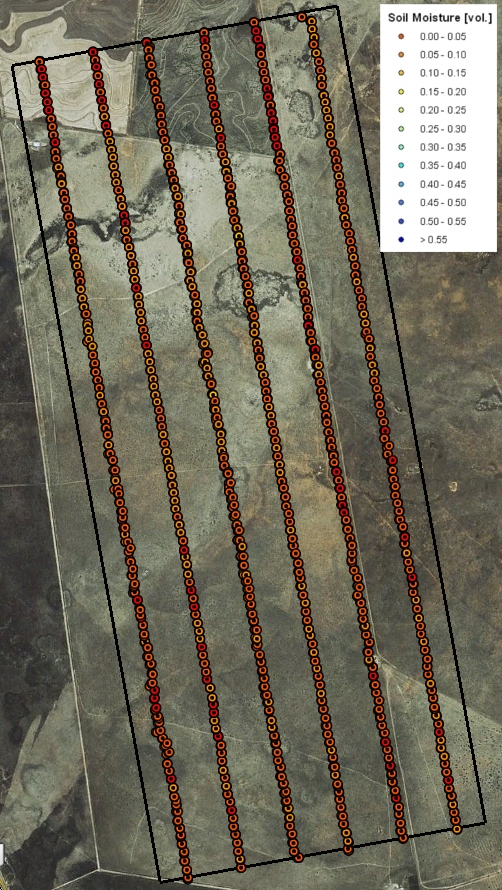
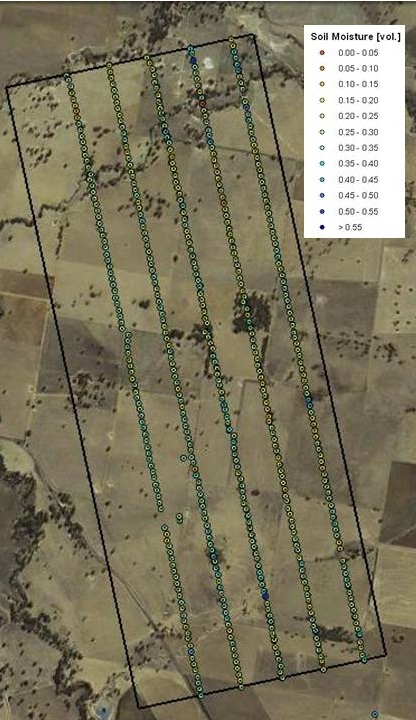
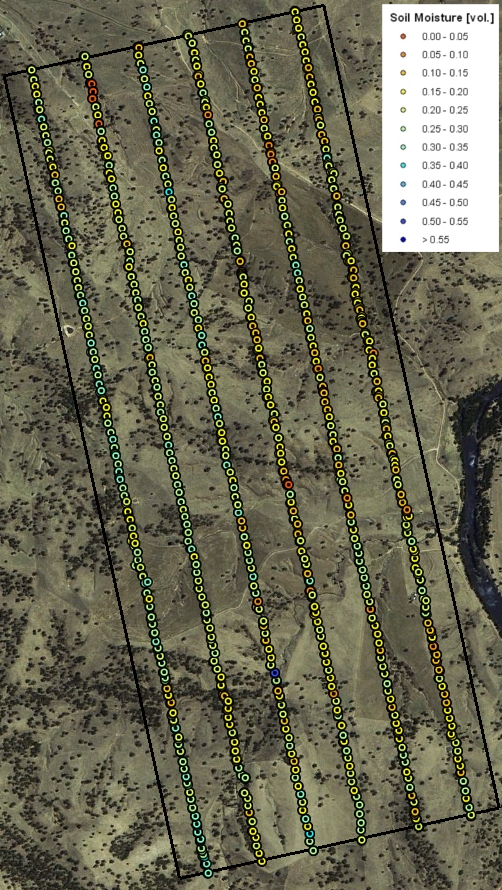
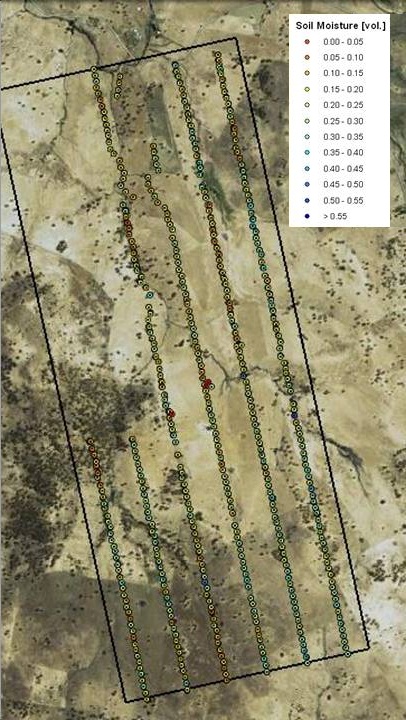
Within each of the flight patches two 2km × 5km areas (oriented along the direction of flight lines) have been established and subdivided by six ground sampling transect lines, each 5km in length and 330m apart. The ground teams made three surface soil moisture measurements (within a radius of 1m) every 50m along these transects using the Hydraprobe Data Acquisition System (HDAS). This allows the effect of random errors in local scale soil moisture measurements to be minimised. To facilitate comparisons between SMOS, airborne observations, and the detailed ground measurements, ground soil moisture sampling took place from 5-9am. The soil moisture calibration equation for the HDAS system has been confirmed prior to the AACES campaign.
In addition to the collected soil moisture data, a number of further ancillary information has been entered and recorded in the HDAS system for each sampling site. This information includes:
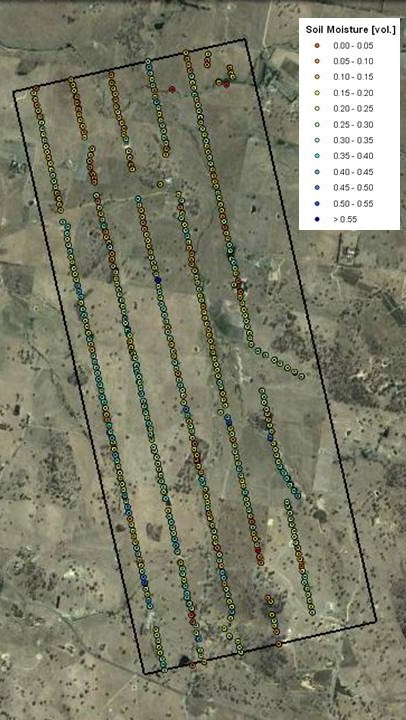
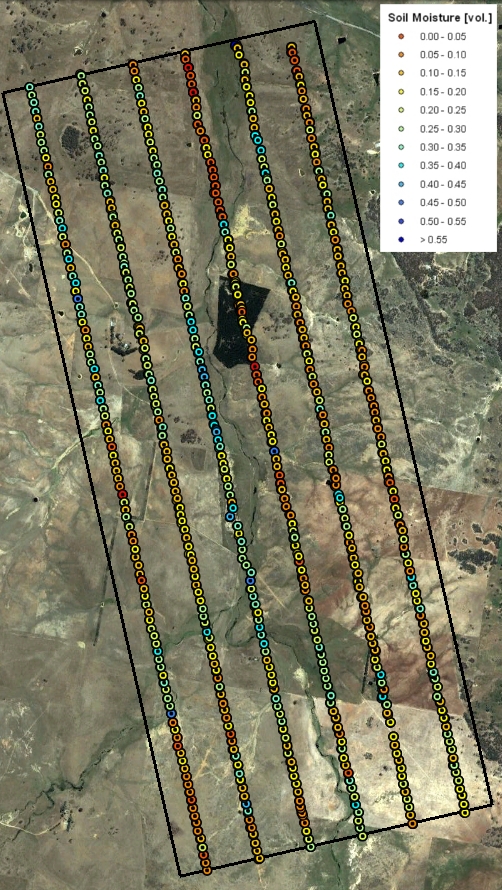
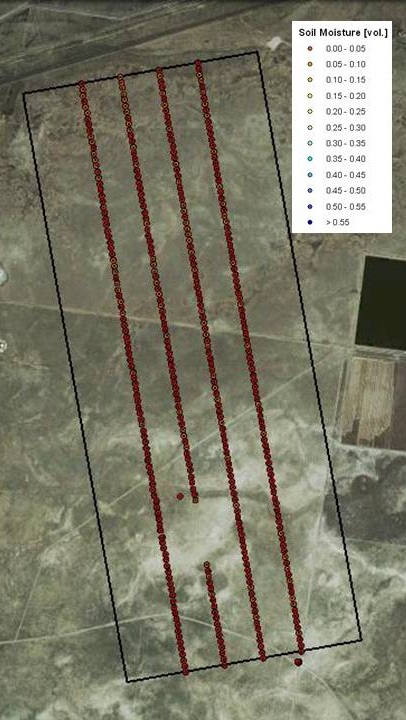
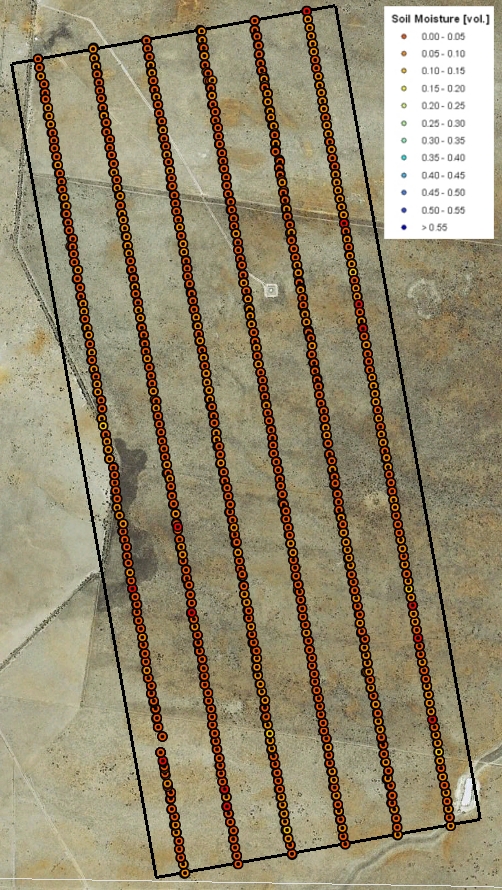
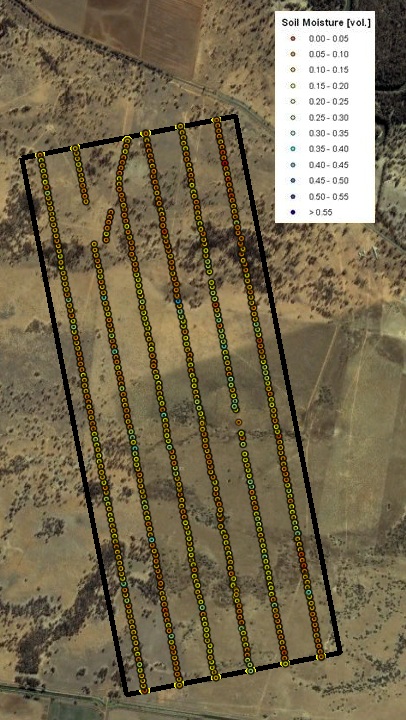
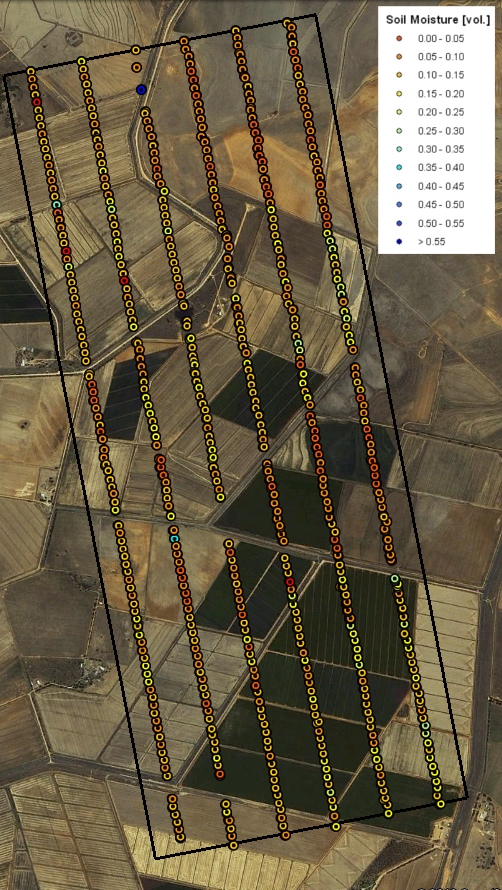
HDAS soil moisture measurementsThe soil moisture data that has been collected at each focus farm is shown as overview below. Users can download the data of the corresponding patch via the Download Centre |
||||
|
Created: January 2010 Last Modified: August 2010 Maintainer: YE Nan, Ye.Nan@monash.edu |
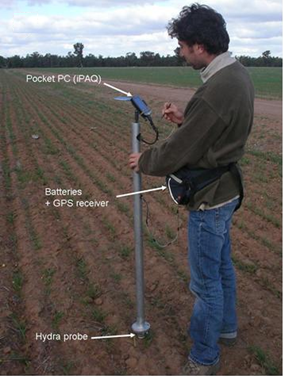 Hydraprobe Data Acquisition System (HDAS)
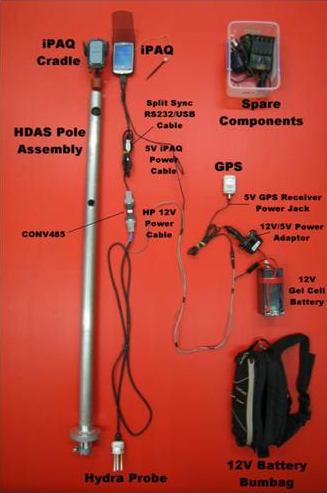 HDAS structure
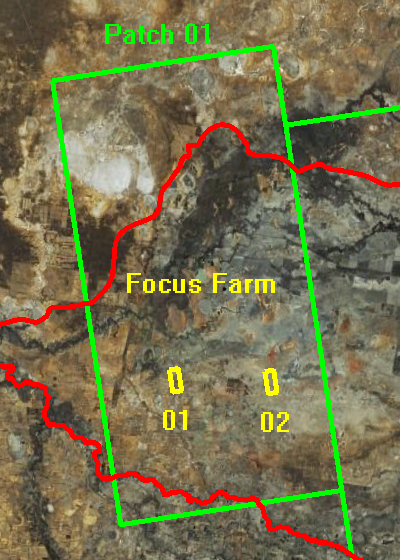 Patch 01; Source: GoogleEarth, accessed on 2nd, May 2010.

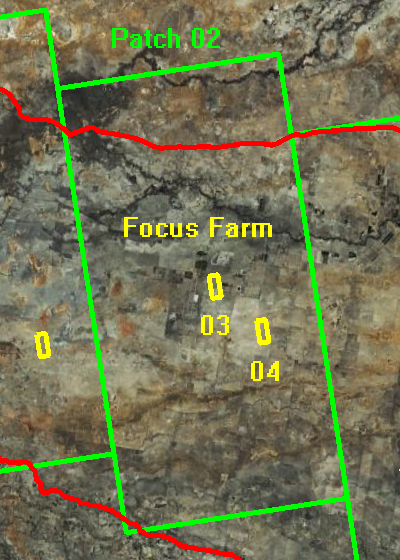 Patch 02; Source: GoogleEarth, accessed on 2nd, May 2010.
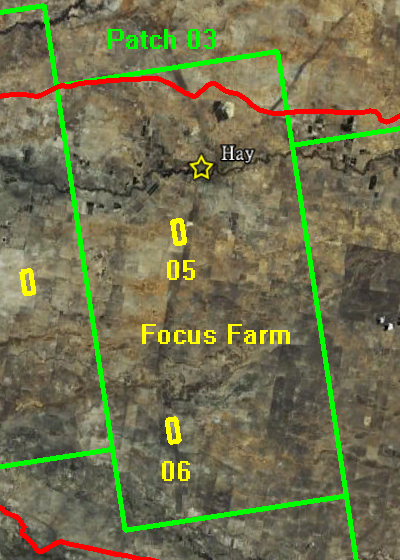 Patch 03; Source: GoogleEarth, accessed on 2nd, May 2010.

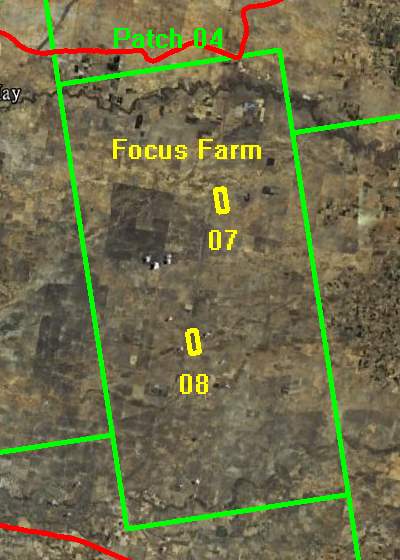 Patch 04; Source: GoogleEarth, accessed on 2nd, May 2010.
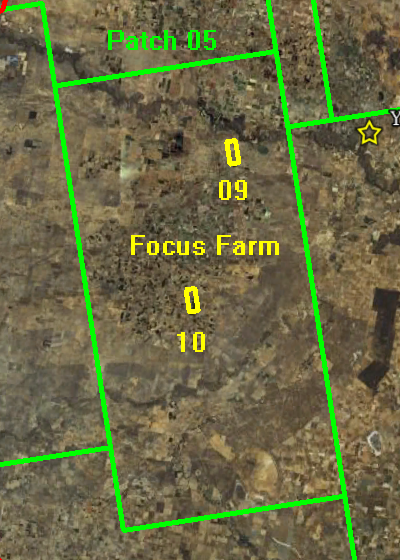 Patch 05; Source: GoogleEarth, accessed on 2nd, May 2010.
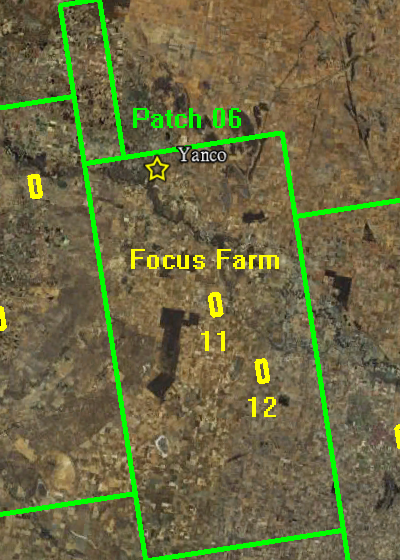 Patch 06; Source: GoogleEarth, accessed on 2nd, May 2010.
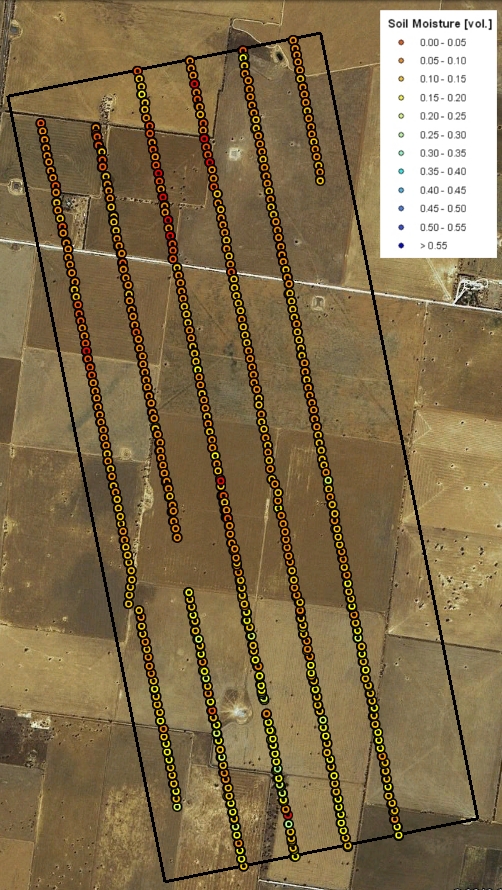

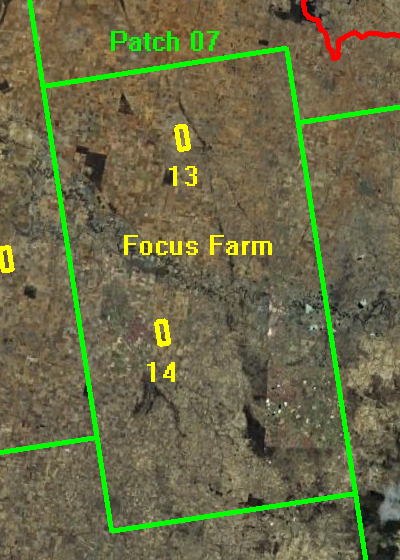 Patch 07; Source: GoogleEarth, accessed on 2nd, May 2010.

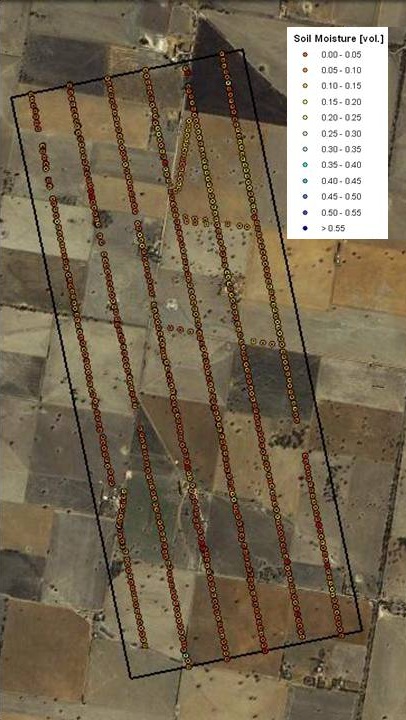
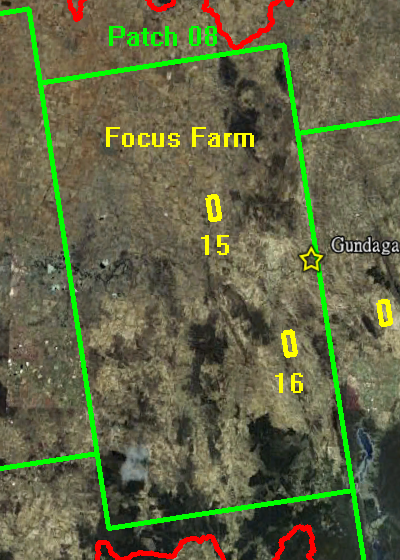 Patch 08; Source: GoogleEarth, accessed on 2nd, May 2010.

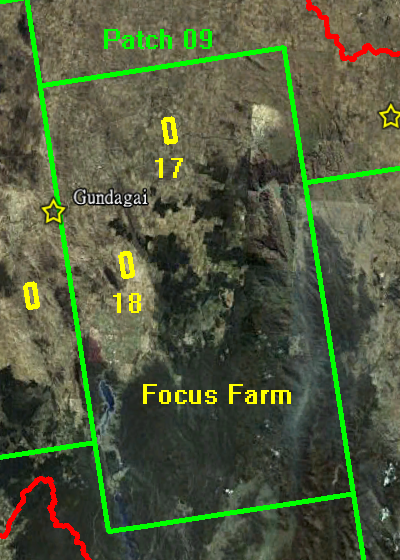 Patch 09; Source: GoogleEarth, accessed on 2nd, May 2010.
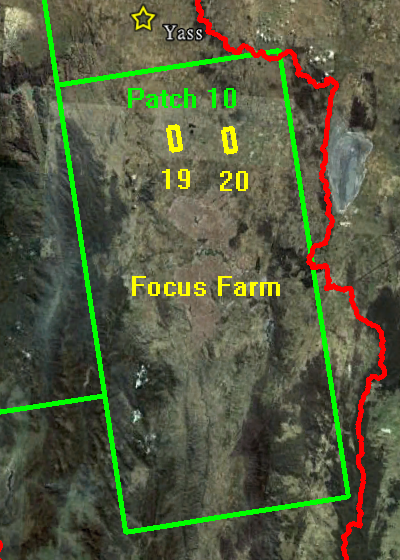 Patch 10; Source: GoogleEarth, accessed on 2nd, May 2010.